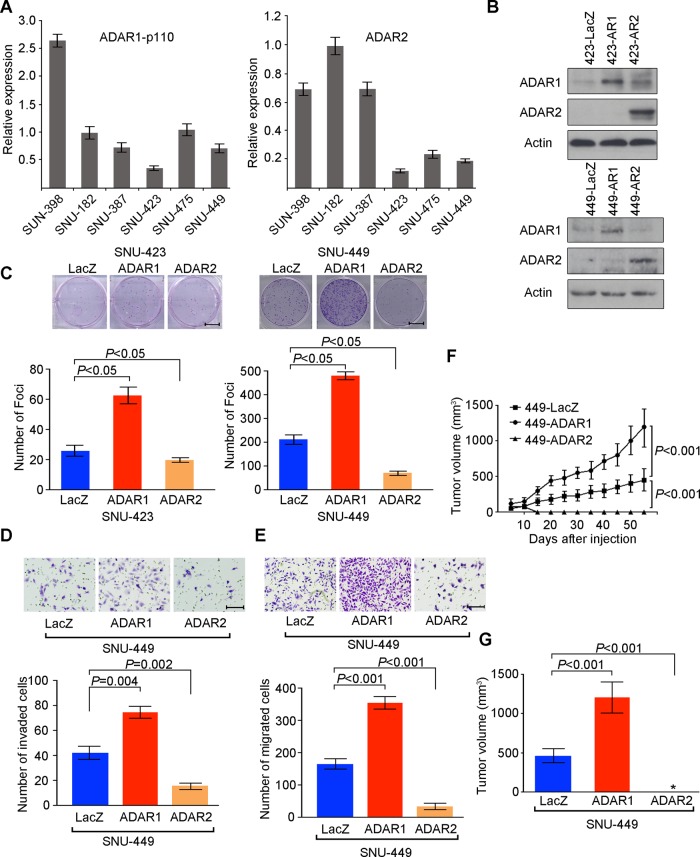
Figure 5.
ADAR1 (Adenosine DeAminase that acts on RNA 1) has oncogenic ability while ADAR2 functions as a tumour suppressor gene. (A) Relative ADAR1 p110 and ADAR2 expression levels in six hepatocellular carcinoma cell lines, as detected by quantitative real time PCR (mean±SD of three independent experiments). (B) Western blotting showing expression of ADAR1 p110 and ADAR2 proteins in the indicated cell lines. β-Actin was the loading control. (C) Quantification of foci formation induced by the indicated stable cell lines. Triplicate independent experiments were performed and the data were expressed as the mean±SD of triplicate wells within the same experiment (unpaired two tailed Student's t test). Scale bar 1 cm. (D, E) Quantification of cells from the indicated cells that invaded through the Matrigel coated membrane (D) or migrated through the polyethylene terephthalate membrane (E) (unpaired two tailed Student's t test). Scale bar 200 μm. (F) Growth curves of tumours derived from the indicated cell lines over a period of 8 weeks. Data are presented as mean±SD (unpaired two tailed Student's t test). (G) Volumes of tumours derived from the indicated cell lines at the end point. Data are presented as mean±SD (unpaired two tailed Student's t test). *undetectable.

