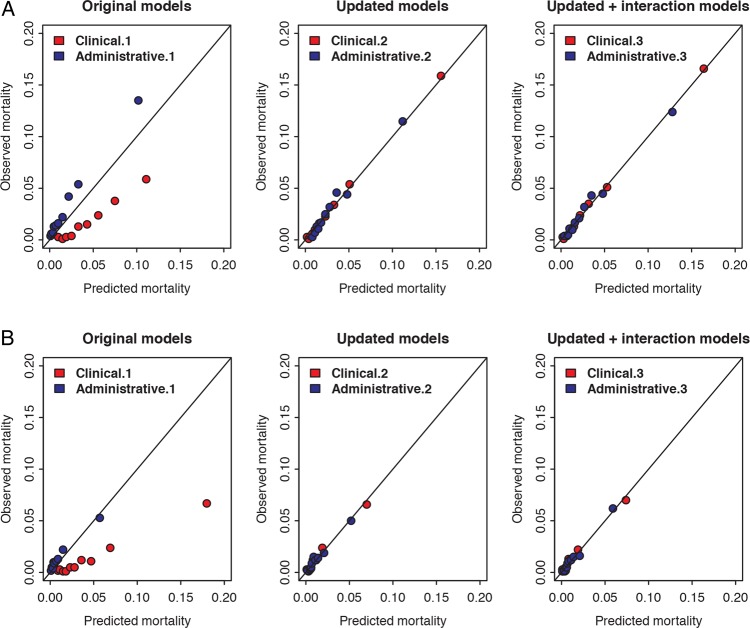
Figure 2.
Calibration plot of the three clinical models and the three administrative models. The calibration plots of the clinical models are depicted in red and the calibration plots of the administrative models in blue. Panel A: models fitted on all cardiac surgery. Panel B: models fitted on isolated coronary artery bypass grafting procedures.

