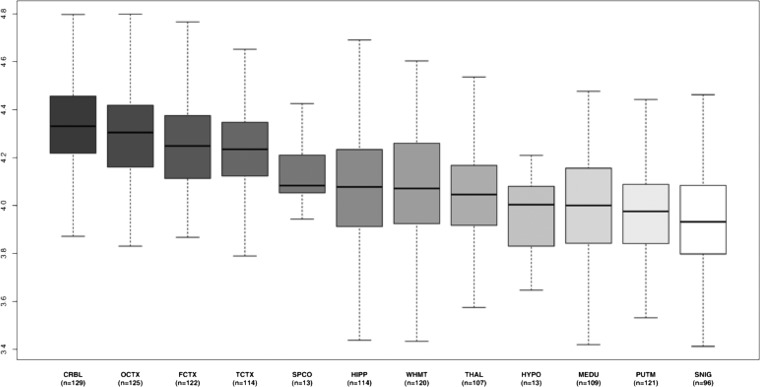
Figure 3.
Expression of C12orf65 in 12 central nervous system (CNS) regions. (A) Box plot of C12orf65 mRNA expression levels in 12 CNS regions. The expression levels are based on exon array experiments and are plotted on a log2 scale (y axis). This plot shows significant variation in C12orf65 transcript expression across the 12 CNS regions analysed: putamen (PUTM, n=121), frontal cortex (FCTX, n=122), temporal cortex (TCTX, n=114), hippocampus (HIPP, n=114), cervical spinal cord (SPCO, n=13), substantia nigra (SNIG, n=96), hypothalamus (HYPO, n=13), medulla (specifically inferior olivary nucleus, MEDU, n=109), intralobular white matter (WHMT, n=120), thalamus (THAL, n=107) and cerebellar cortex (CRBL, n=129). Whiskers extend from the box to 1.5× the IQR.

