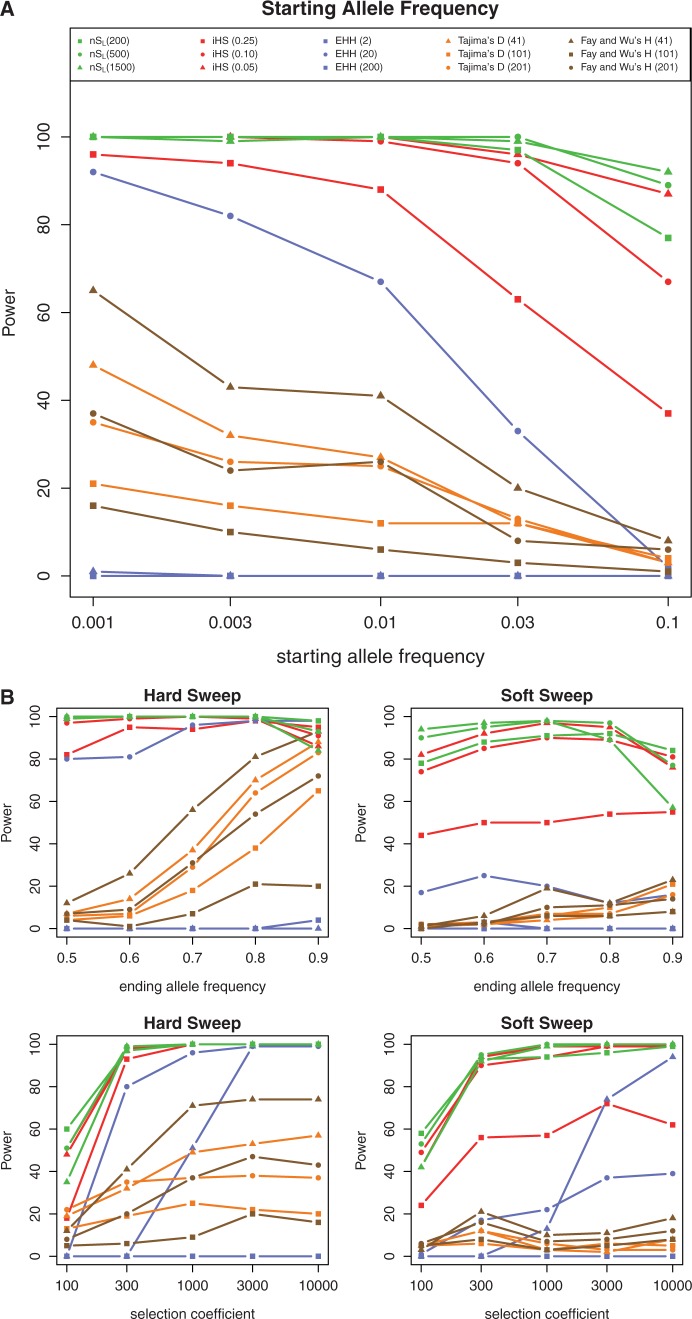
Fig. 2.
(A) The power of five methods (nSL, iHS, EHH, Tajima’s D, and Fay’s and Wu’s H) for a range of starting allele frequencies (0.001–0.1). Power is defined as the proportion of simulations that reject the neutral null hypothesis at the 5% significance level. Each color corresponds to a method and symbols correspond to the window sizes used to run the methods (the specific window sizes used for the analysis are given in parenthesis). (B) The power of the five methods for a range of ending allele frequencies (0.5–0.9) (top two panels). The bottom two panels show the power of the methods for a range of selection coefficients (4Ns = 100−10,000). The color scheme and symbols in these panels correspond to the legend embedded in (A).

