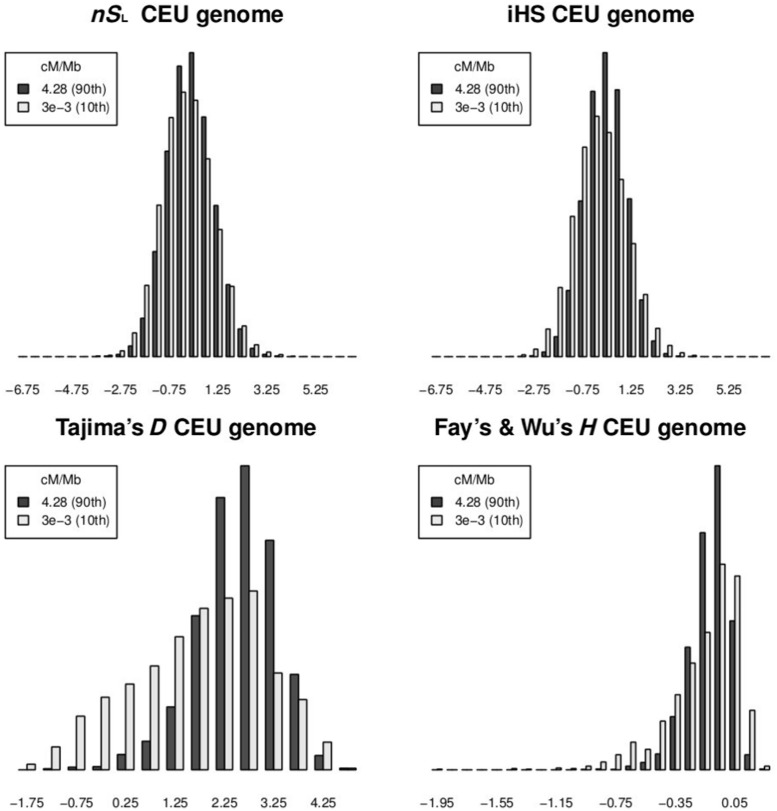
Fig. 3.
Robustness to recombination rate. Distribution of nSL, iHS, Tajima’s D, and Fay’s and Wu’s H for regions with high (black) and low (gray) recombination rate. Plots are made with whole-genome genotype data for the HapMap3 CEU population (Utah residents with Northern and Western European ancestry from the CEPH collection).

