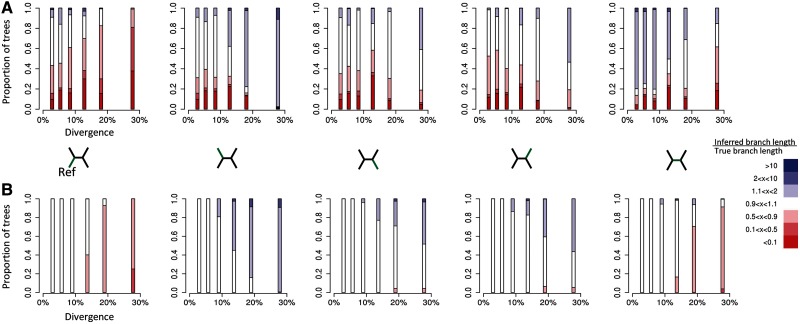
Fig. 4.
Deviation of relative branch lengths, as inferred from mapped sequence alignments, from the true relative branch lengths for (A) phylogenies inferred using SNP positions only and (B) phylogenies inferred using all positions. For each branch in our simulated four-taxon trees, the figure shows the proportion of trees in which the estimated relative branch length deviated from the true relative branch length to a certain degree (color).The trees were subdivided into six equally sized bins based on the overall divergence level (proportion of columns within the original multiple sequence alignment that contain SNPs) and the branch length ratios were calculated for each divergence class (position on the x-axis). The proportion of trees inferred from mapped sequence alignments that contain relative branch lengths that are more than ten times greater than those from the true tree are shown in dark blue. Relative branch lengths that are more than ten times shorter are shown in dark red. Relative branch lengths that are within 10% of the true branch length are shown in white (see legend). The figure shows one plot for each of the five branches within the tree (this branch is indicated in green in the four-taxon trees between A and B). The reference sequence is always the taxon on the bottom left of the tree. Trees were only included in the statistics if the mapped tree topology matched the true (known) tree topology.

