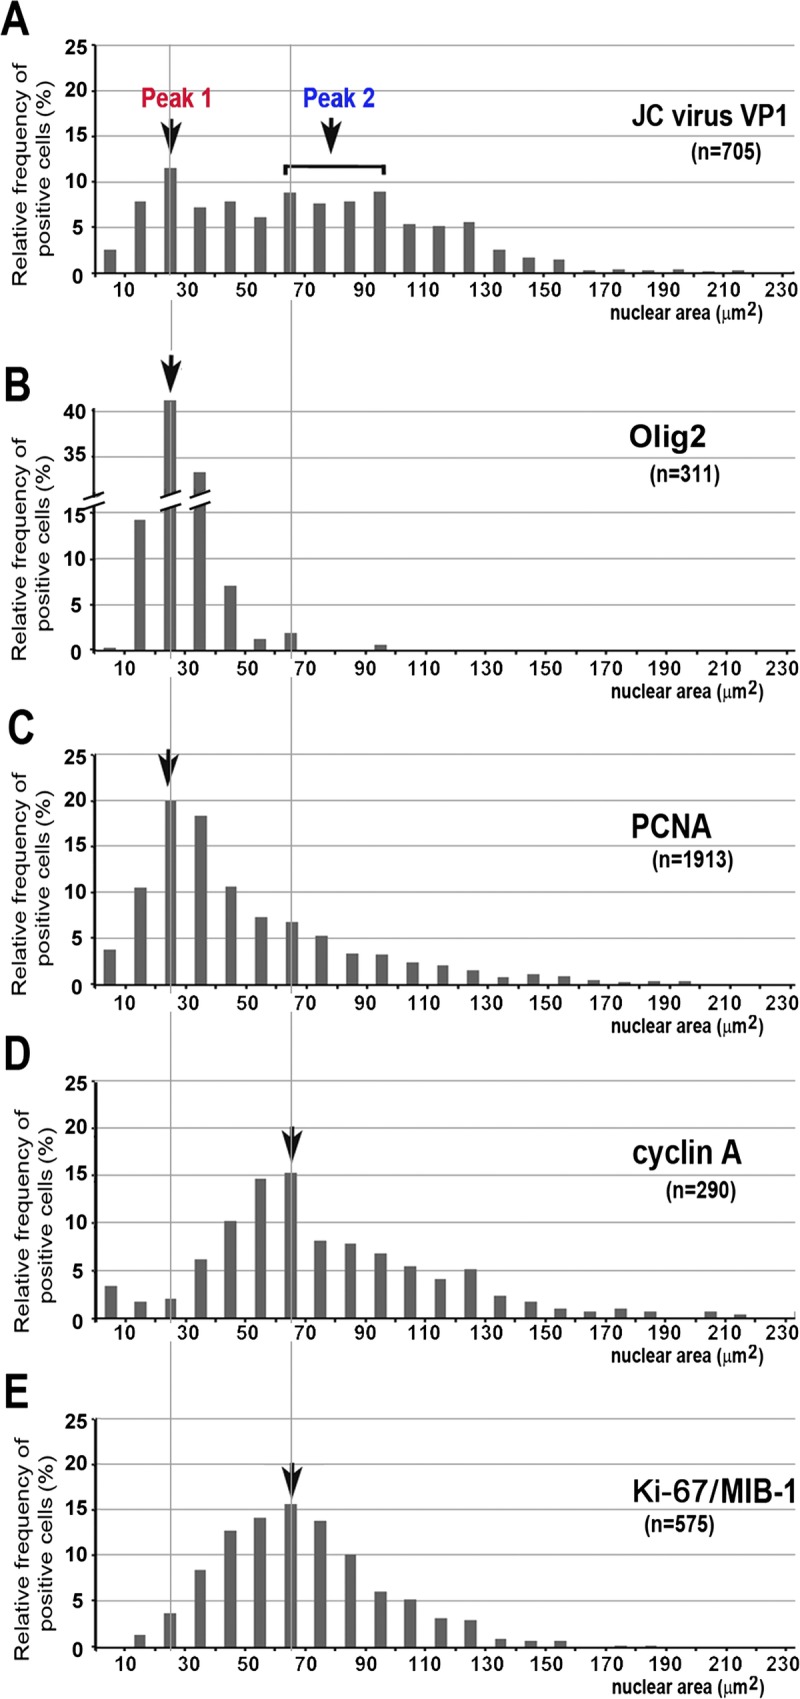
FIGURE 3.

Cell cycle transition through an S-to-G2–like state with nuclear enlargement. Distribution of cells immunoreactive to JC virus VP1 (A), OLIG2 (B), PCNA (C), cyclin A (D), and Ki-67 (E), in relation to cross-sectional nuclear area. In cells immunoreactive to JC virus VP1, 2 populations were operationally designated as Peak 1 (20–30 μm2) and Peak 2 (60–100 μm2). Cells immunoreactive to OLIG2 (B) and PCNA (C) showed the highest relative frequency in nuclei ranging from 20 to 30 μm2. In contrast, cells immunoreactive to cyclin A (D) and Ki-67 (E) showed the highest relative frequency in nuclei ranging from 60 to 70 μm2.
