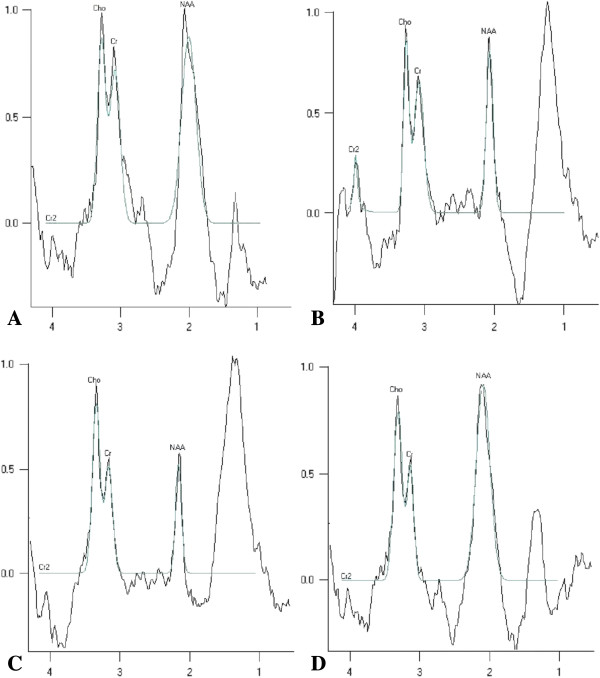
Figure 5.
1H-MRS spectra of the various groups. A) 1H-MRS spectra in the sham group had upright steep peaks of NAA and Cho. A Lac peak was not detected. B) 1H-MRS spectra in the MCAO group revealed a reduction in the NAA peak and distinct upright, steep peaks of Lac were detected at 24 h after MCAO. C) 1H-MRS spectra in the saline group revealed a reduction in the NAA peak. Similar to the saline group, upright steep peaks of Lac were detected at 24 h after MCAO. D) 1H-MRS spectra in the hUCB-MSC group at 24 h after MCAO. Compared with MCAO and saline groups, the NAA peak was higher and the Lac peak was lower.

