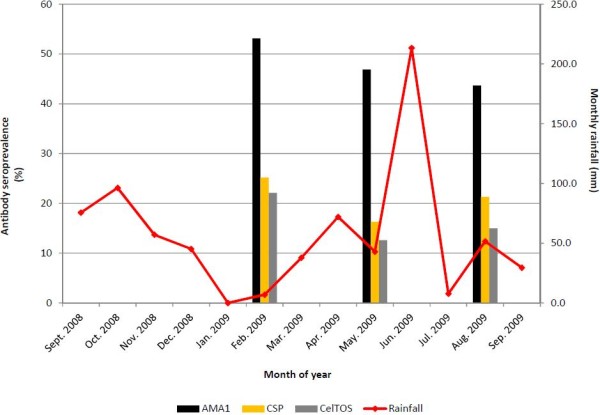
Figure 2.

Proportion of seropositive individuals and monthly rainfall over study period. For each antigen, seropositivity was defined using a mixture model, which involves maximum likelihood estimation of seronegative individuals from a Gaussian distribution of OD data for each antigen. No statistically significant differences were found amongst the proportions seropositive at the three time points for any of the three antigens.
