
Figure 2.
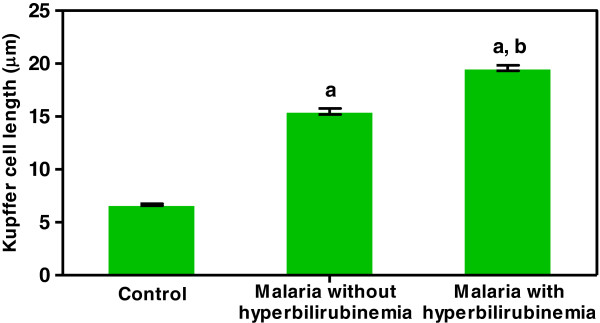
Length of Kupffer cells as measured and analyzed by Image Tool software. Significant differences in Kupffer cell length were observed between the severe malaria groups (with and without hyperbilirubinaemia) and the normal controls (a) and between the hyperbilirubinaemia and non-hyperbilirubinaemia groups (b) (p < 0.05). Data are presented as a mean ± SEM.