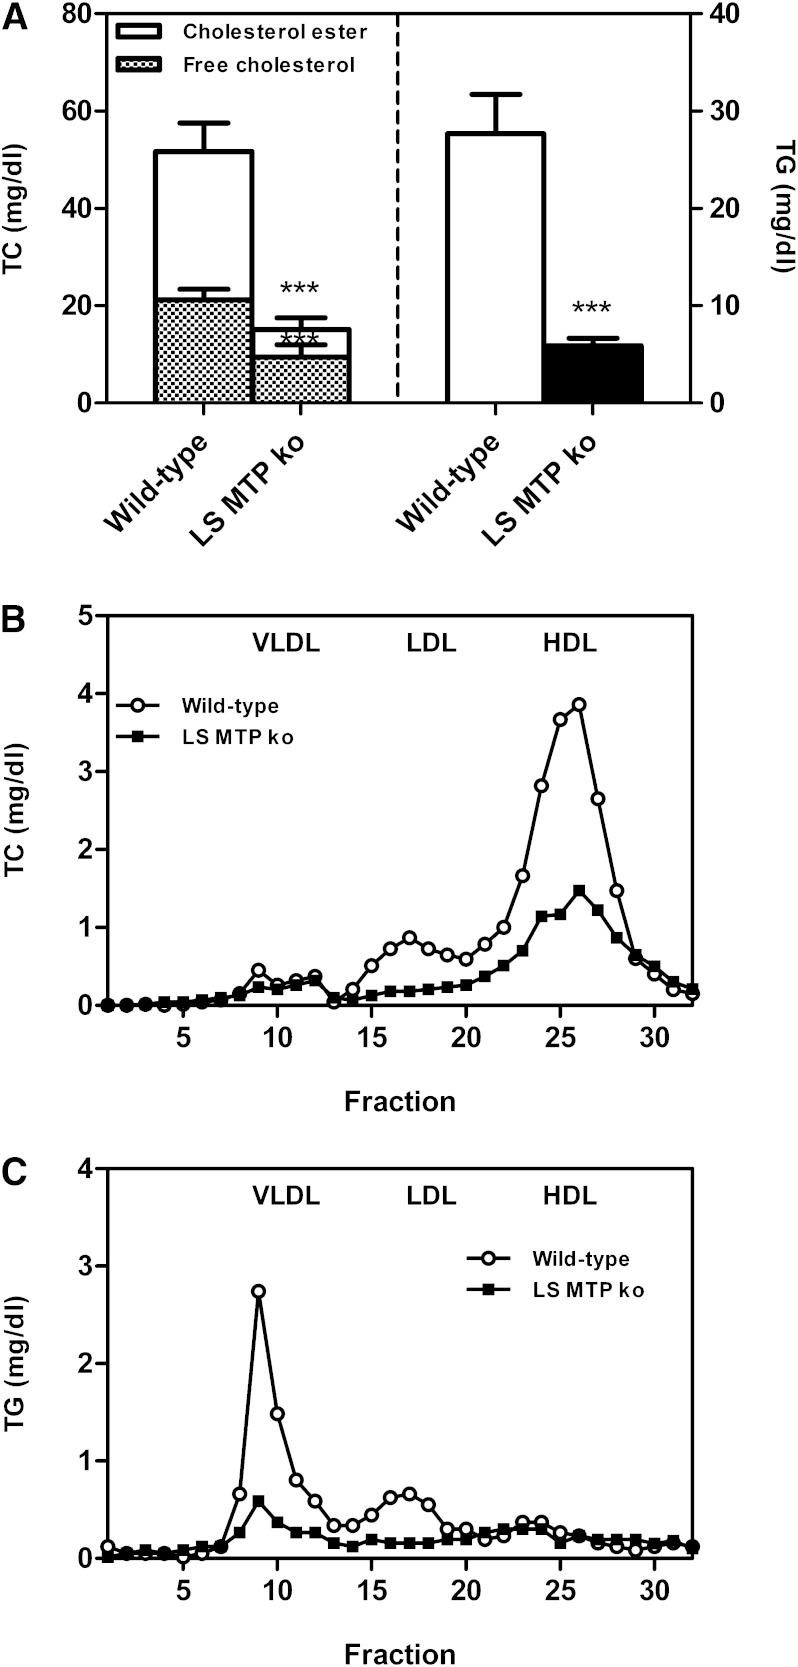
Fig. 4.
Impact of hepatocyte-specific MTP deficiency (L-Mttp−/−) on plasma lipid levels and distribution. L-Mttp−/− mice were fasted for 4 h and a blood sample was taken. A: Plasma total cholesterol and triglyceride levels. Data are presented as means ± SEM. Statistically significant differences from control mice are indicated as ***P < 0.001. FPLC profiles of pooled plasma samples for the distribution of total cholesterol (B) and triglycerides (C) over the different lipoprotein subclasses as indicated. At least n = 6 for each group.

