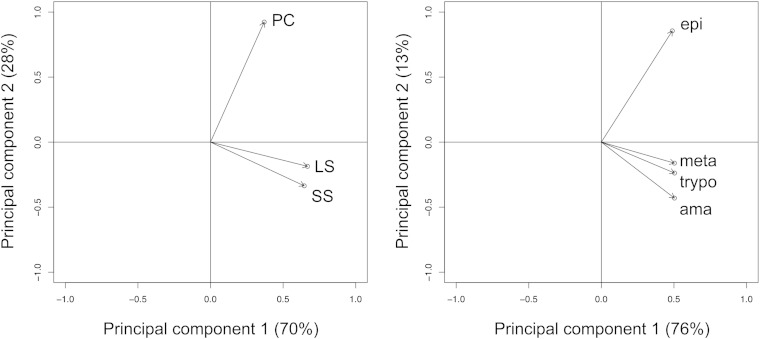
Fig. 6.
Expression profiles in Trypanosoma spp. Loading plots based on PC-1 and PC-2 of the steady-state mRNA levels of sterol biosynthetic genes expressed in count per million. A: T. brucei procyclic forms (PC) and long slender (LS) and short stumpy (SS) bloodstream forms. B: T. cruzi epimastigotes (epi), metacyclics (meta), trypomastigotes (trypo), and amastigotes (ama).

