
Figure 3.
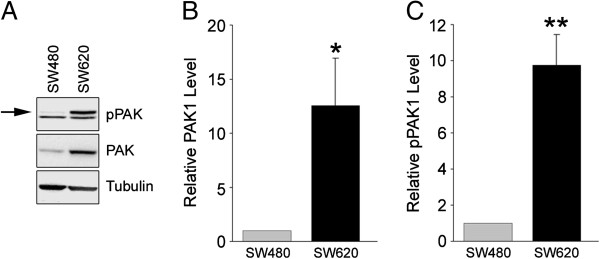
Increased PAK1 expression and phosphorylation in SW620 cells. (A) Detergent extracts prepared from SW480 and SW620 cells were analyzed by immunoblotting for phosphorylated (p)PAK1, total PAK1 and tubulin. (B) Graph showing the quantification of total PAK1 levels by densitometric analysis of immunoblots. (C) Quantification of pPAK1 levels. The intensity of the upper pPAK1 band (arrow in A) was measured and normalized to the level of tubulin. Values are the average ± S.E.M. of four independent experiments. One asterisk denotes a significant difference (P < 0.05) and two asterisks, a highly significant difference (P < 0.01) from SW480 cells by Student’s t-test.