
Figure 6.
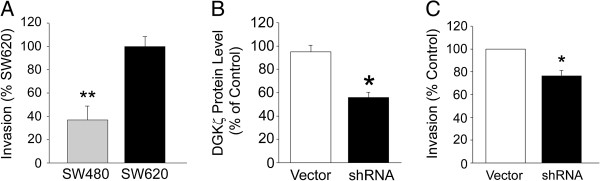
Silencing DGKζ Expression Decreases Invasiveness of SW620 Cells. SW480, SW620, SW620/Vector, and SW620/shRNA cells were placed in the upper chamber of a Transwell invasion plate and allowed to migrate across a Matrigel-coated, porous membrane for approximately 72 hrs. (A) Graph comparing the invasion of SW480 and SW620 cells. (B) Graph showing the average DGKζ level in SW620/Vector and SW620/shRNA cell lines normalized to the DGKζ level in SW620 cells. (C) Graph showing the average invasion of SW620/Vector and SW620/shRNA cell lines. Values are the mean ± S.E.M. from seven independent experiments. One asterisk indicates a significant difference (P < 0.05) and two asterisks, a highly significant difference (P < 0.005) from SW620 cells by Student’s t-test.