
Figure 7.
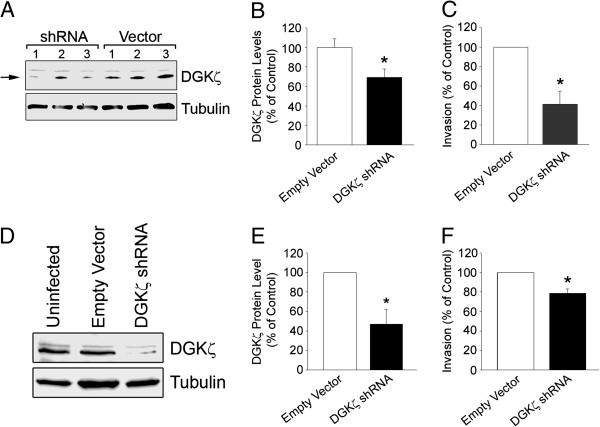
DGKζ Silencing Attenuates Invasion of PC-3 Prostate and MDA-MB-231 Breast Cancer Cells. (A) Western blot of DGKζ (arrow) in three PC-3/Vector and three PC-3/shRNA cell lines. Tubulin is shown for comparison. (B and C) Graphs showing the average DGKζ level (B) and invasion through Matrigel-coated Transwell inserts (C) of PC-3/Vector and PC-3/shRNA cell lines. The data were normalized to Empty Vector control cells. Values in B and C are the mean ± S.E.M. from five independent experiments. (D) Western blot of DGKζ in MDA-MB-231/Vector and MDA-MB-231/shRNA cells. Tubulin is shown for comparison. (E and F) Graphs showing the average DGKζ level (E) and invasiveness (F) of MDA-MB-231/Vector and MDA-MB-231/shRNA cells, normalized to the level in Empty Vector control cells. Values in E and F are the mean ± S.E.M. from four independent experiments. An asterisk indicates a significant difference (P < 0.05) from Vector cells by Student’s t-test.