
Figure 3.
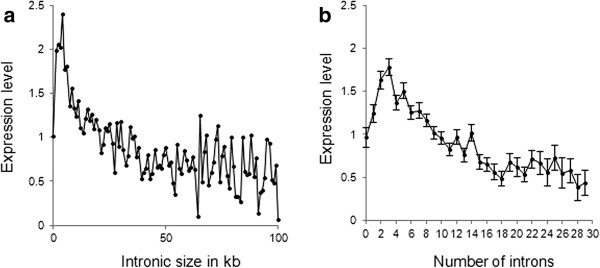
The association between the mean gene expression levels in diverse normal human tissues and the total intron size (panel a) and number of introns (panel b). Vertical lines on the right panel are standard errors of mean. Expression level is shown in Z-scores.