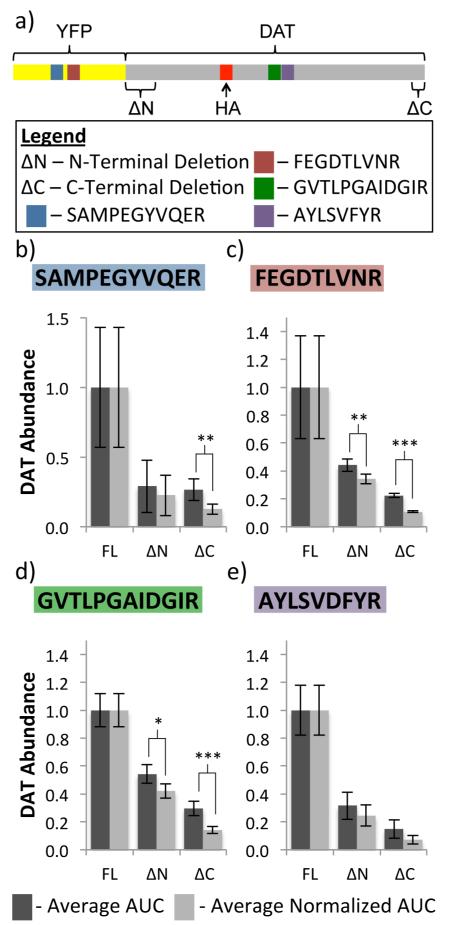
Figure 4.
Relative normalization of DAT AUCs to mouse IgG AUCs: (a) schematic of YFP and DAT peptide locations. (b-e) Comparison of pre- and postnormalization DAT abundance using one example mouse IgG heavy chain peptide (VNSAAFPAPIEK) to normalize two YFP (b,c) and two DAT (d,e) peptides. (*p < 0.10, **p < 0.05, ***p < 0.01).

