
Figure 1.
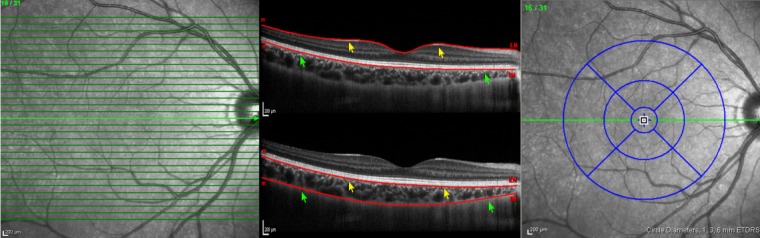
EDI SD-OCT raster scan protocol (left), automated retinal segmentation (middle top), manual choroidal segmentation (middle bottom), and standardized grid (right) including three concentric rings with a total of nine subfields centered on the fovea. Internal limiting membrane line (yellow arrows) and basement membrane line (green arrows) on automated retinal segmentation was moved to the base of retinal pigment epithelium (yellow arrows) and chorioscleral interface (green arrows) to demarcate choroidal boundaries (middle bottom).