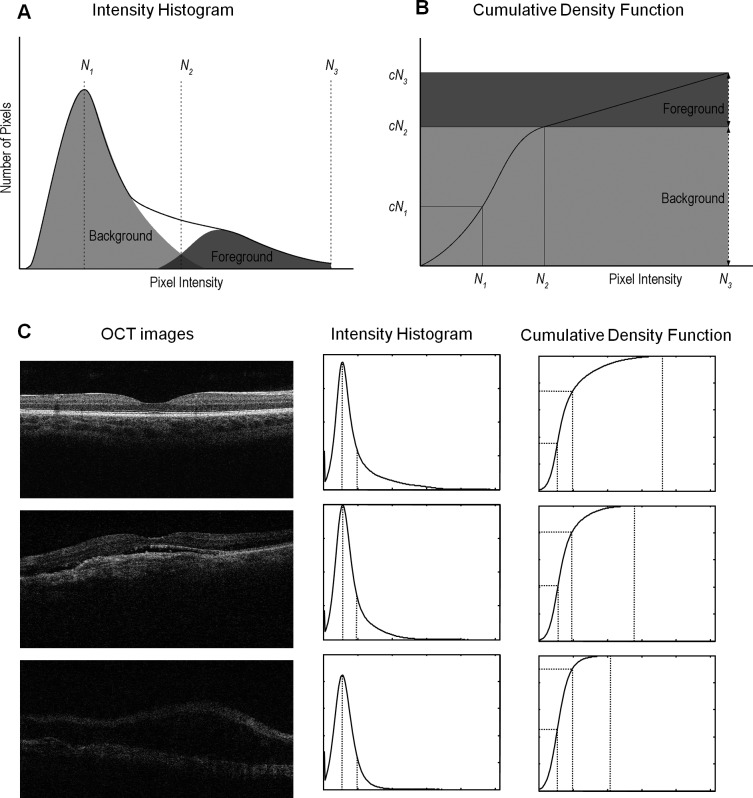
Figure A1.
Histogram density modeling and decomposition of an OCT image. (A) Schematic drawing of the intensity histogram of an OCT image. Solid line shows the envelope of the histogram, and dotted lines show the relative composition between background and foreground pixels. N1, N2, and N3 denote the signal intensity values of the mode point, the separation point between background and foreground, and the saturation point. (B) Schematic drawing of the cumulative density function (CDF) of an OCT image. N1, N2, and N3 and cN1, cN2, and cN3 denote the signal intensity and cumulative density values of the mode point, the separation point between background and foreground, and the saturation point. (C) Three representative OCT images with strong, moderate, and weak signals, and their associated intensity histogram and cumulative density functions. The mTCI values of these three images (from strong to weak) are 6.95, 5.55, and 3.50, respectively.

