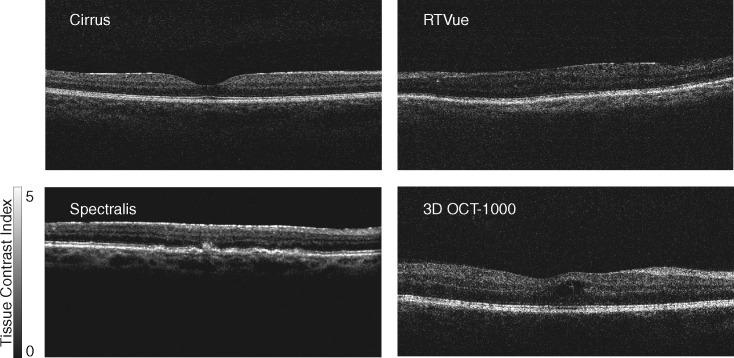
Figure 5.
Representative OCT B-scans from four spectral domain-OCT devices were converted using the tissue contrast index, and displayed in the same gray scale. The mTCI measurements of these images are 5.00, 5.12, 4.87, and 4.92, respectively. Pixel intensity was mapped to a range varying from black (TCI = 0) to white (TCI = 5).

