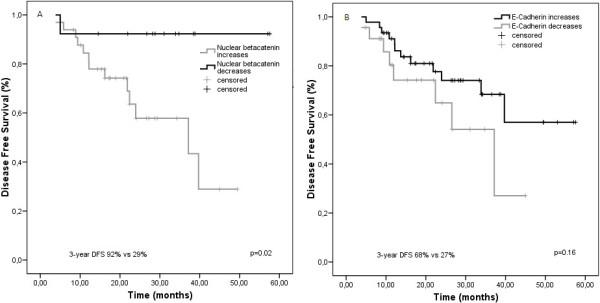
Figure 4.

Kaplan-Meier estimates of disease-free survival according to increase or decrease of β-catenin and E-cadherin expression after CRT. A and B. Data on disease-free survival (DFS) for the entire group are shown according to stratification on the basis of the increase or decrease of nuclear β-catenin and membranous E-cadherin expression after CRT.
