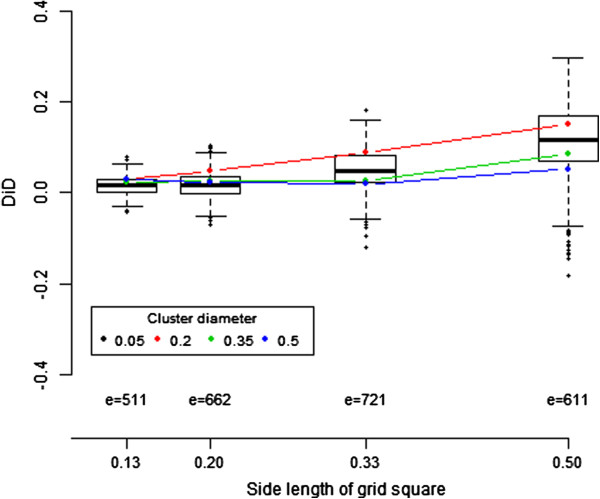
Figure 5.

Distribution of the Difference in Distance (DiD) from the center of the located high risk area to the focus point of the cluster and to the average centroid. The number e is the number of iterations where DBM locates a high risk area of reasonable geographic extent. For cluster diameter 0.2, the distribution is displayed as a boxplot of the e DiD values. For each cluster diameter 0.05, 0.20, 0.35 and 0.50, we report the median of the e DiD values with a colored dot.
