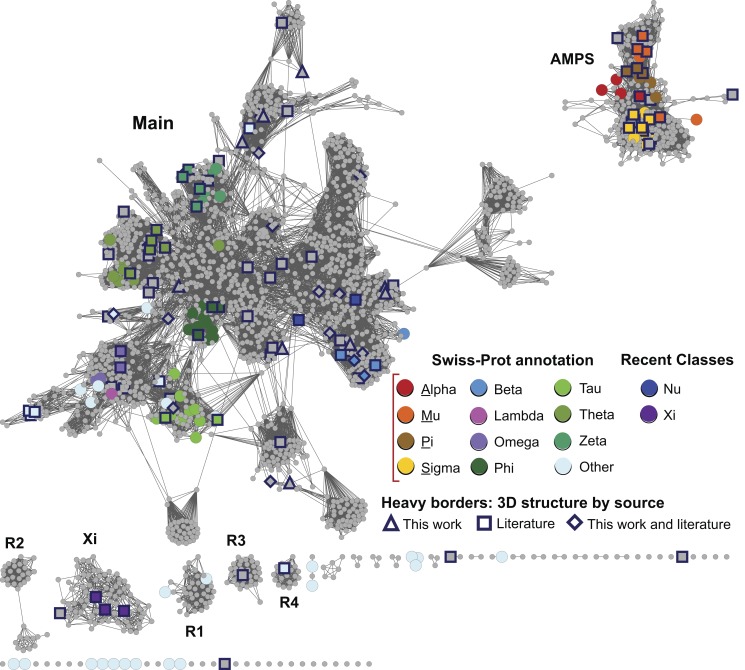
Figure 1. Global view of sequence relationships in the cytGST superfamily.
This level 1 representative network shows 2,190 nodes representing 13,493 proteins filtered at 50% sequence identity. A cluster (a group of interconnected nodes separated from other groups of interconnected nodes) is labeled if there are at least 50 member sequences in that cluster. These include the large and diverse Main subgroup, the AMPS subgroup containing the Swiss-Prot classes Alpha, Mu, Pi, and Sigma, the recently described Xi subgroup, and several smaller but distinct clusters labeled R1–R4. Colors assigned correspond to Swiss-Prot annotations for canonical cytGST classes or to annotations from the literature for the newer classes Nu and Xi. These representative nodes are colored only if at least 50% of Swiss-Prot annotated sequences in that node have been assigned to that class. Grey nodes denote representative nodes for which no corresponding Swiss-Prot annotation is available for a class for greater than 50% of the annotated sequences in that node. Heavy borders indicate that a 3D crystal structure is associated with at least one member sequence of a representative node and shape indicates the source of the structure data: triangle, structures that were solved for this work; square, from the literature; diamond, structure evidence both from this work and the literature. Edges or lines between nodes are shown if the least significant pairwise sequence similarity score between the representative sequences of two nodes is better than the threshold (BLAST E-value≤1×10⁻¹³). The 32,716 edges depicted have a median percent sequence identity of 33% over 208 residues.

