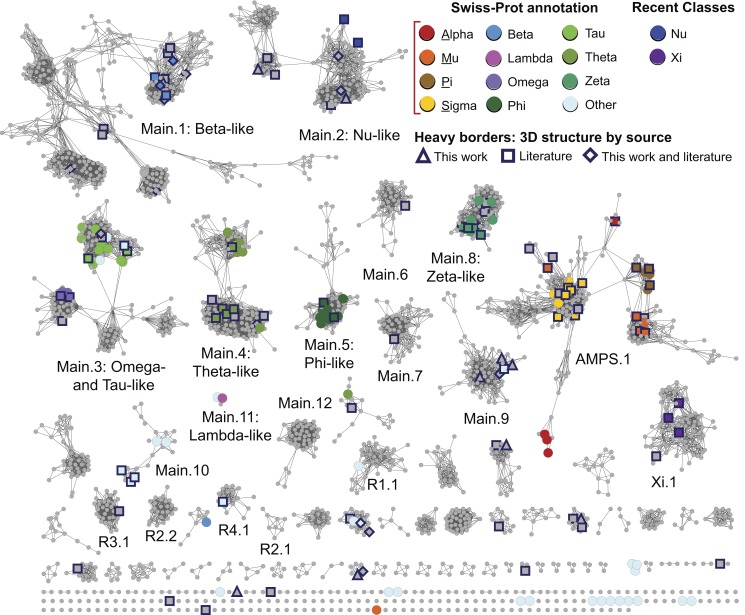
Figure 2. The level 2 representative network shows more detailed subgroupings.
The same network as in Figure 1 except that it is visualized at a higher stringency threshold, i.e., E-value≤1×10⁻²⁵. Coloring is the same as in Figure 1. The 15,070 edges depicted in the figure have a median percent sequence identity of 38% over 212 residues. As with level 1 subgroups, clusters are designated as level 2 subgroups if there are at least 50 member sequences in that cluster.

