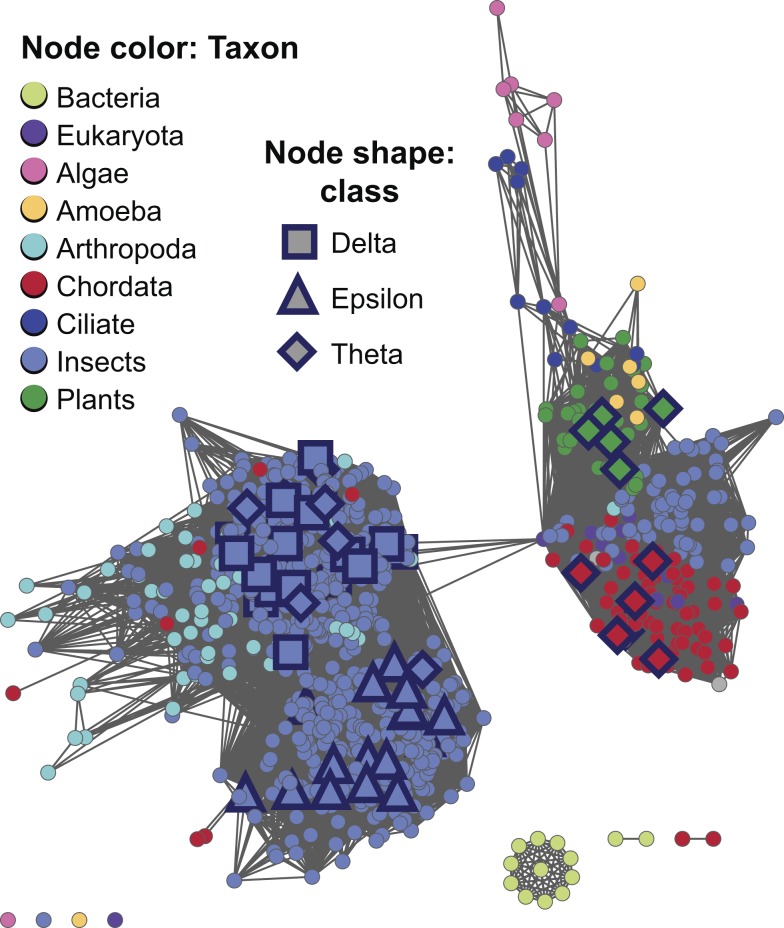
Figure 7. Full sequence similarity network of level 2 subgroup Main.4 indicating conflicting classifications from the literature.
Edges are shown if they meet the similarity threshold of a BLAST E-value≤1×10⁻³¹. Shapes indicate class annotation from the literature: square, Delta; triangle, Epsilon; and diamond, Theta. To show more detail, colors are for taxonomic classifications from NCBI Taxonomy at a finer grained level than that used in the representative network shown in Figure 6. There are 872 sequences in the network with a median percent sequence identity for the 92,539 edges of 44% over 209 residues. Literature references for class annotations can be obtained from the network file for this subgroup available for download from the SFLD.

