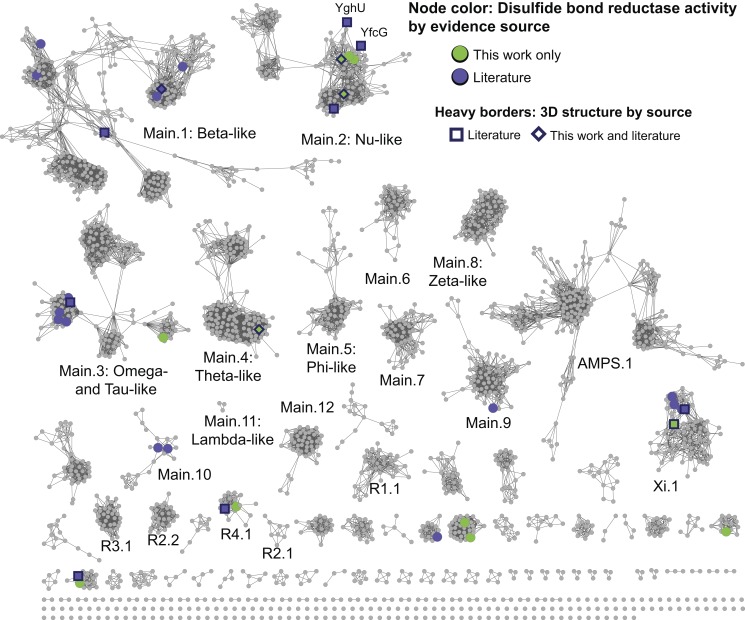
Figure 8. New experimental evidence for DSBR activity in many level 2 subgroups.
The level 2 sequence similarity network is painted by DSBR activity. Nodes are colored if one or more member sequences in a representative node have experimental evidence for DSBR activity. Green indicates the evidence comes from only from this work and purple indicates evidence is from the literature. One representative node, labeled with member sequence YghU, has evidence both from the literature and this work. Heavy borders indicate that a 3D crystal structure is associated with at least one member sequence of a representative node where DSBR activity occurs and shape indicates the source of the structure data: square, from the literature; diamond, structure evidence both from this work and the literature.

