
Figure 3.
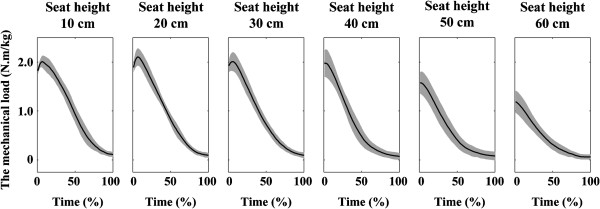
Ensemble average of the mechanical load during STS movements from the seat heights of six different heights. Time = 0 and 100 (%) respectively indicates the instance of seat-off and finish time. The grey area indicates ± 1 standard deviation of the ensemble average. The mechanical load reached a peak near the time of 0%.