
Figure 4.
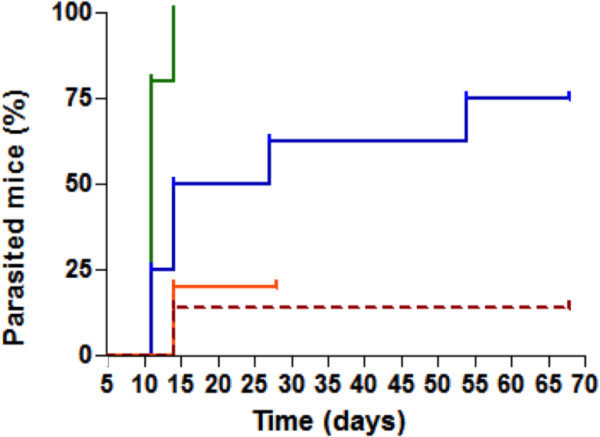
Delay for parasitic recrudescence. GraphPad Prism® is used to draw these curves. The colours used in this graph are the same as those used on Figure 2.
Official websites use .gov
A
.gov website belongs to an official
government organization in the United States.
Secure .gov websites use HTTPS
A lock (
) or https:// means you've safely
connected to the .gov website. Share sensitive
information only on official, secure websites.
Delay for parasitic recrudescence. GraphPad Prism® is used to draw these curves. The colours used in this graph are the same as those used on Figure 2.