Figure 1. Acquired stimuli.

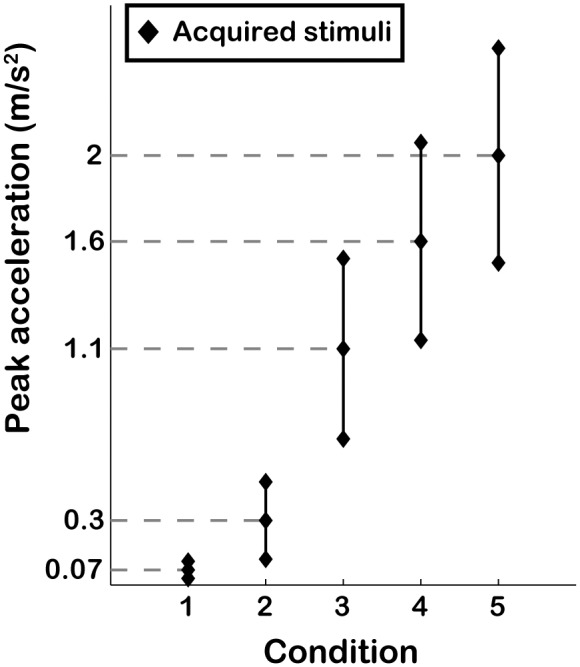
Graphical representation of peak amplitude for the acquired stimuli for both upward and downward motion. The dashed lines indicate the reference intensities, around which the higher and lower comparison were set.

Graphical representation of peak amplitude for the acquired stimuli for both upward and downward motion. The dashed lines indicate the reference intensities, around which the higher and lower comparison were set.