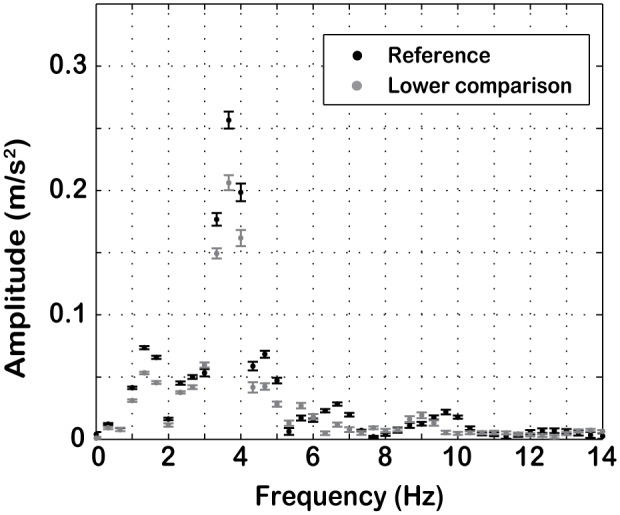
Figure 3. Amplitude-frequency spectrum.

Example of an amplitude-frequency spectrum for a reference of 1.6 m/s2 and corresponding lower comparison. In this example the simulator noise mainly affects frequencies around 4 Hz. Error bars represent standard deviations of the 20 repetitions of each profile. The abscissa is limited to only the first 61 frequency components (0–20 Hz) out of the 241 (0–80 Hz) used for the analysis for better graphical clarity.
