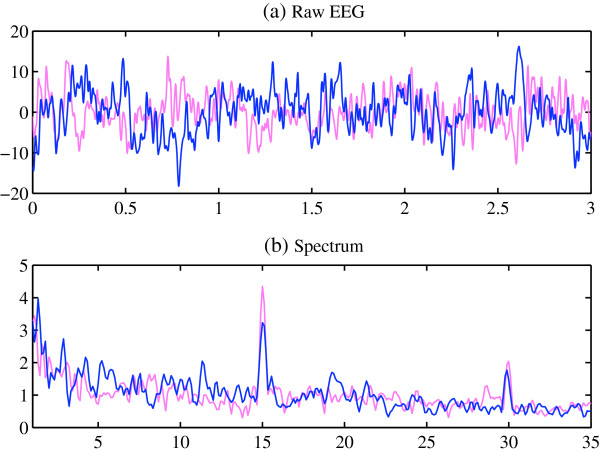
Figure 1.
Comparison of Raw EEG signal and the spectrum of an individual participant between the alert and fatigue states for Experiment 1. Vertical axis for (a) and (b), amplitude (μV); horizontal axis for (a), time (sec); horizontal axis for (b), frequency (Hz); red curve: alert state; blue curve: fatigue state.

