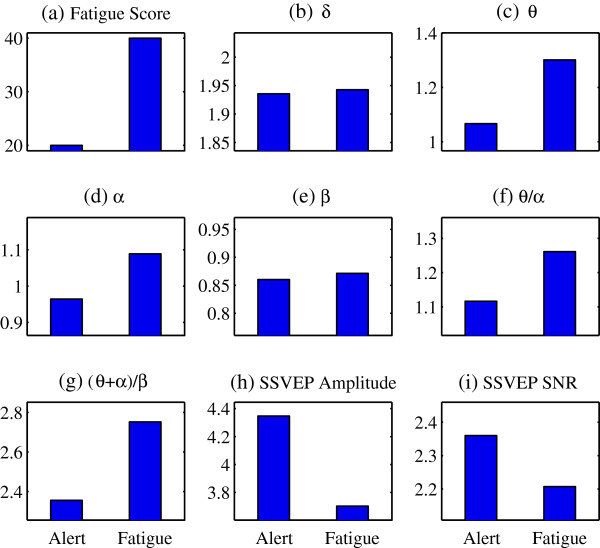
Figure 2.
Comparison of indices of an individual participant between the alert and fatigue states for Experiment 1. Comparison of the average values and SD of fatigue score, EEG indices, ratio indices, as well as SSVEP amplitude and SNR in the alert and fatigue states. Vertical axis for (b)-(i), amplitude (μV); horizontal axis for (a)-(i), Alert: alert state, Fatigue: fatigue state.

