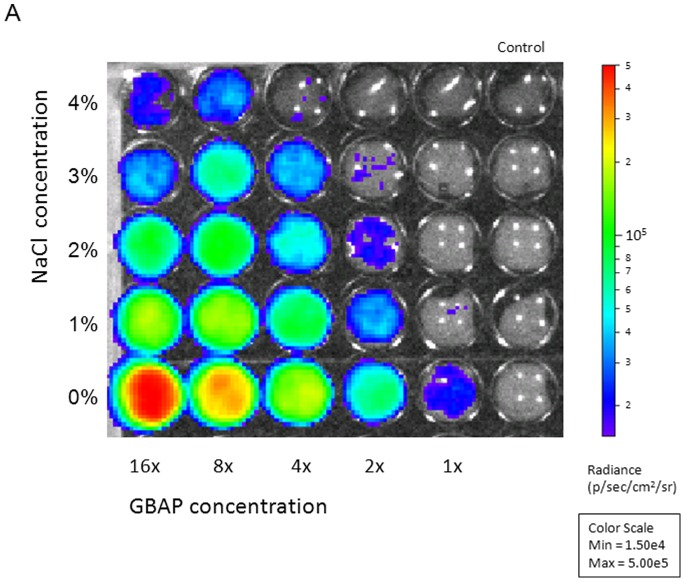
Figure 6. Quantification of gelE promoter activity in the GBAP-negative E. faecalis OU510.
Cells were grown to an optical density at 600∼ 0.2 before the addition of medium containing NaCl and GBAP (gelatinase-biosynthesis activating pheromone). Growth and promoter activity were monitored in replicate plates for 10 h at 37°C. Promoter activity was negatively correlated with NaCl concentration and positively correlated with GBAP concentration. The figure represents a snapshot of the promoter activity 2 hours after the addition of NaCl and GBAP. NaCl concentrations ranged from 0–4%, while there was a 2-fold serial dilution of GBAP from left to right. The images were obtained using an IVIS Lumina II system with an exposure time of 1 min and a binning value of 4. The color bar indicates the signal intensity in p/sec/cm2/sr (RLU; relative light units).

