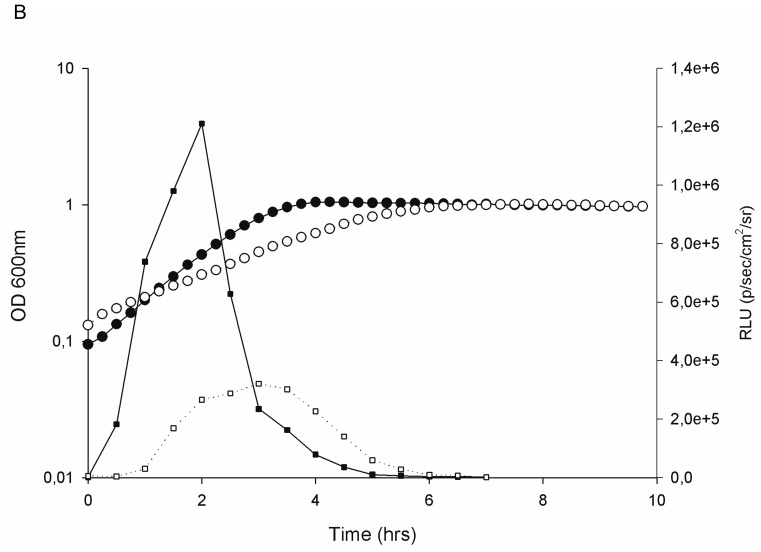
Figure 7. Time course of cell growth and gelE promoter activity.
Growth of the GBAP-negative E. faecalis OU510 with 3% NaCl (○) compared to medium without salt added (•), and promoter activity in response to addition to equal amounts of GBAP measured as RLU (▪ = no NaCl, □ = 3% NaCl). All the values are the means from two independent experiments.

