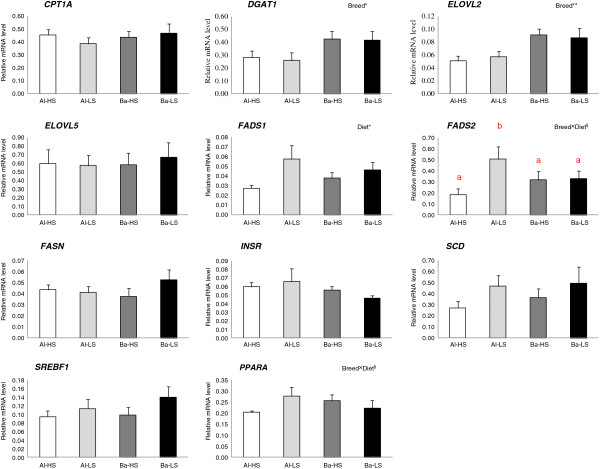
Figure 1.
Relative expression levels of eleven selected genes in the liver from Alentejana and Barrosã bulls fed high or low silage diets. Each value was normalized to RPS9 and SDHA expression. Al-HS: Alentejana bulls fed the high silage diet; Al-LS: Alentejana bulls fed the low silage diet; Ba-HS: Barrosã bulls fed the high silage diet; Ba-LS: Barrosã bulls fed the low silage diet. Error bars indicate standard error. †Tendencies were considered for 0.05 < P < 0.10. a,b,cLeast square means with different superscripts differ at least P < 0.05.

