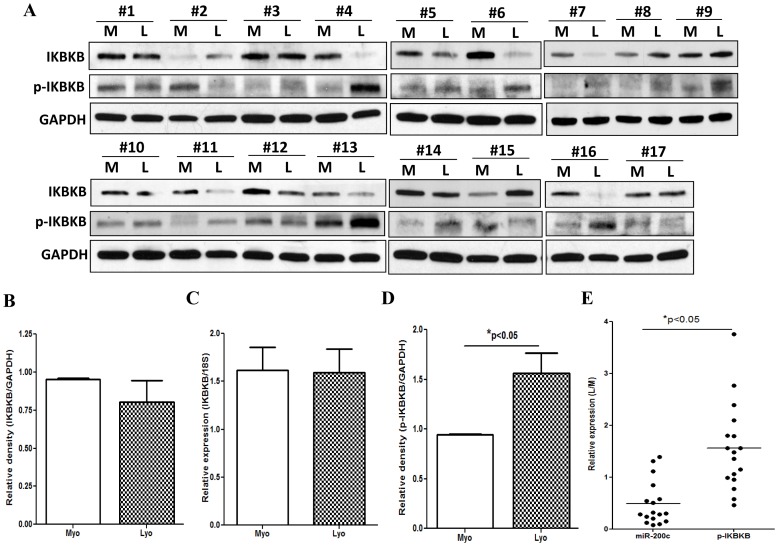
Figure 2. phosphorylated IKBKB displayed an inverse relationship with miR-200c expression.
Figure 2A shows western blot analysis of IKBKB and phosphorylated IKBKB (p-IKBKB) (Ser 177/181) of tissue extracts (N = 17) from leiomyomas (L) and paired myometrium (M) with GAPDH was used as loading control. The relative band densities of IKBKB (Fig. 2B) and phosphorylated IKBKB (Fig. 2D) in leiomyoma and paired myometrium were determined and compared with values in myometrium independently set as 1 for each pair. Figure 2C shows relative expression of IKBKB mRNA level in leiomyoma and paired myometrium from untreated group (N = 49). The data were analyzed using nonparametric student t-test. Figure 2E shows the relative expression miR-200c as compared to the level of phosphorylated IKBKB (p-IKBKB) in above 17 leiomyomas as compared to matched myometrium. The results were analyzed using paired student t-test and corresponding lines with asterisks denote statistical significance.

