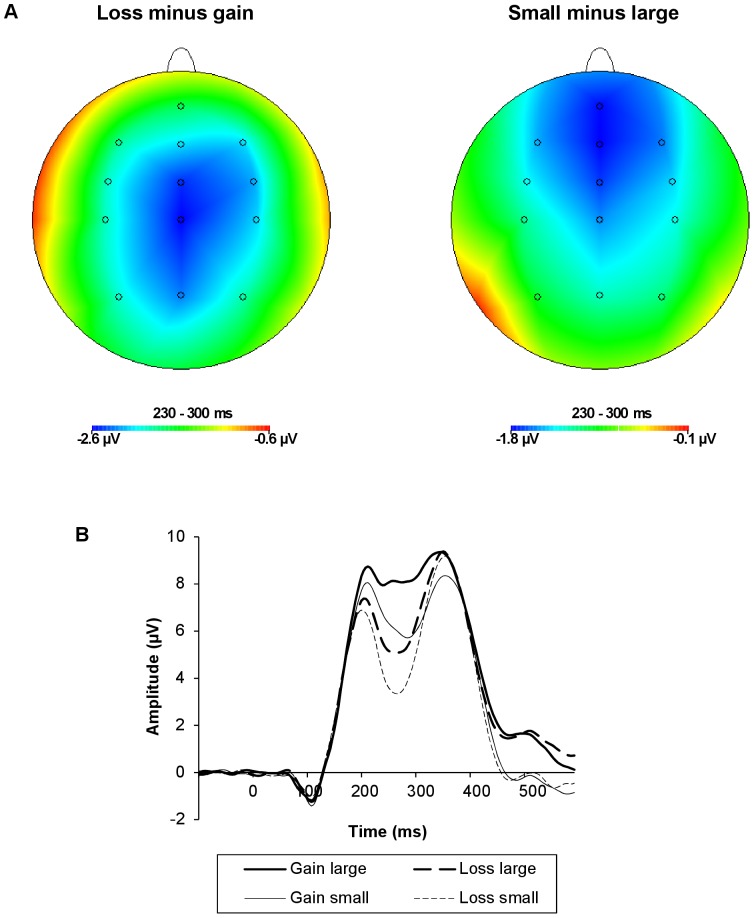
Figure 1. Topographical voltage maps and ERPs from FCz as a function of feedback valence and magnitude.
(A) Topographical voltage maps (230–300 ms post-feedback) of the difference between loss and gain trials (left) and the difference between small and large outcome trials (right). (B) ERPs: The solid lines represent gain trials; the dashed lines represent loss trials. Thick lines represent large outcome trials; thin lines represent small outcome trials. The FRN was more negative in response to losses compared to gains, and in response to small relative to large outcomes.

