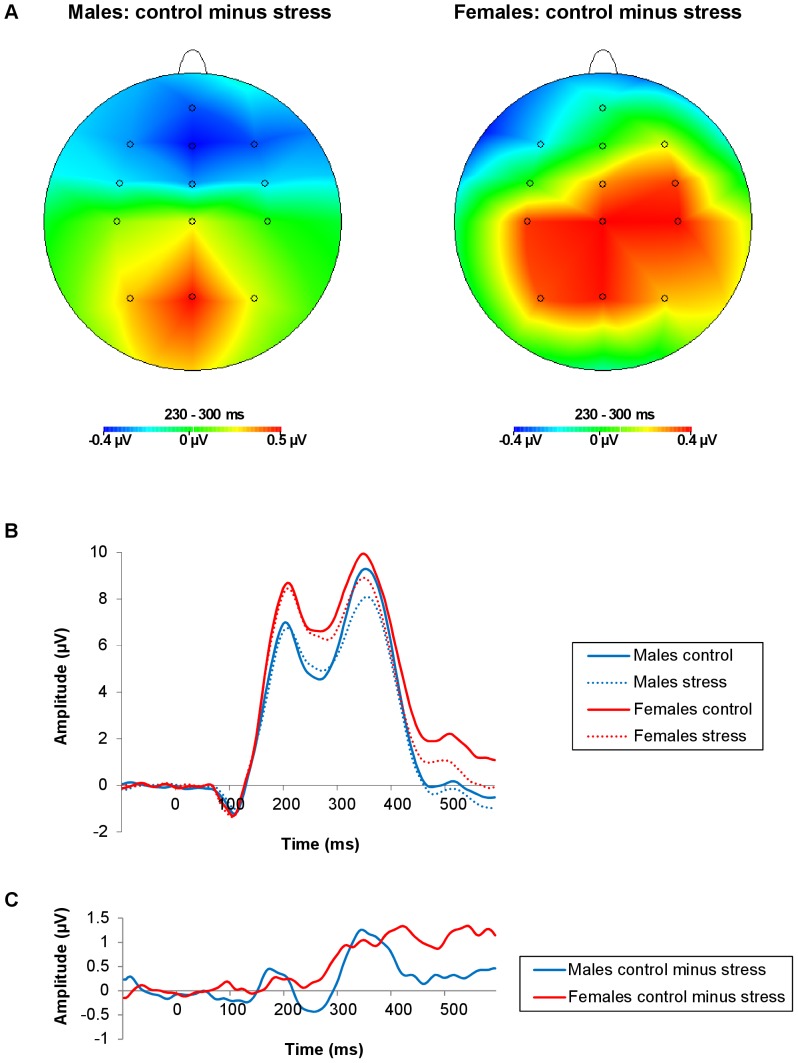
Figure 2. Topographical voltage maps and ERPs from FCz as a function of stress induction and sex.
(A) Topographical voltage maps (230–300 ms post-feedback) of the difference between control condition and stress condition trials, for males (left) and females (right), separately. (B) ERPs: The solid lines represent control condition trials; the dotted lines represent stress condition trials. The blue lines represent males; the red lines represent females. (C) ERP difference waves of control minus stress condition trials, for males (blue line) and females (red line). The FRN amplitude was smaller in the stress relative to the control condition, but only as quantified by the mean amplitude (230–300 ms post-feedback) corrected for both preceding (180–225 ms) and following (320–390 ms) components. Sex did not modulate the FRN significantly.

