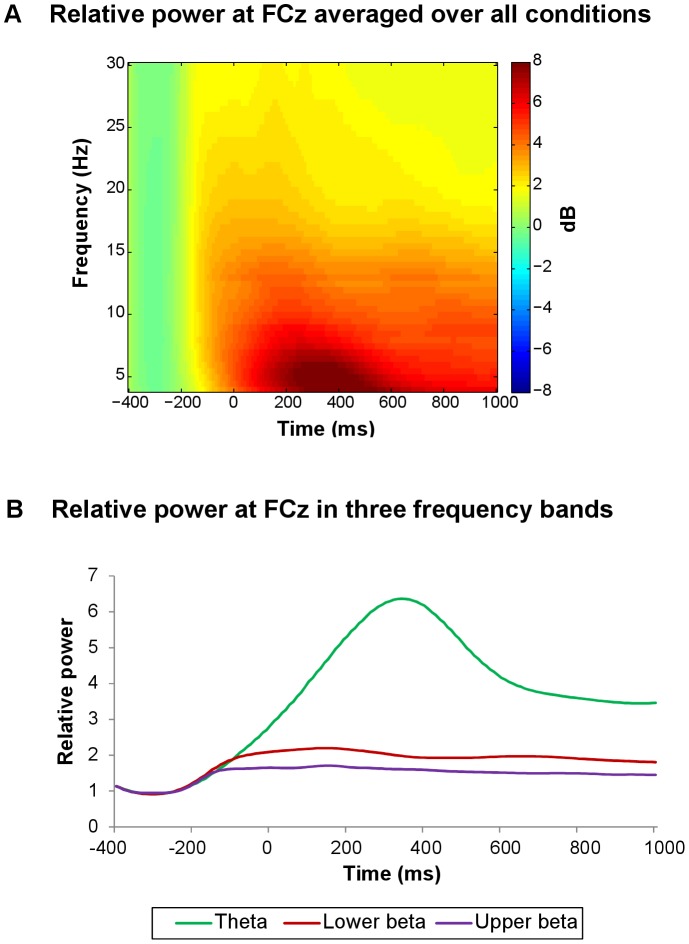
Figure 3. Time-frequency plot and line plots of relative power in different frequency bands, averaged over all conditions.
(A) Time-frequency representation of relative power at FCz averaged over all conditions. Only for time-frequency plots, relative power averages were converted to a decibel (dB) scale, enabling comparison between different frequencies. (B) Line plots of relative power at FCz in the theta-band (4–7 Hz), lower beta-band (13–20 Hz), and upper beta-band (21–30 Hz), averaged over all conditions.

