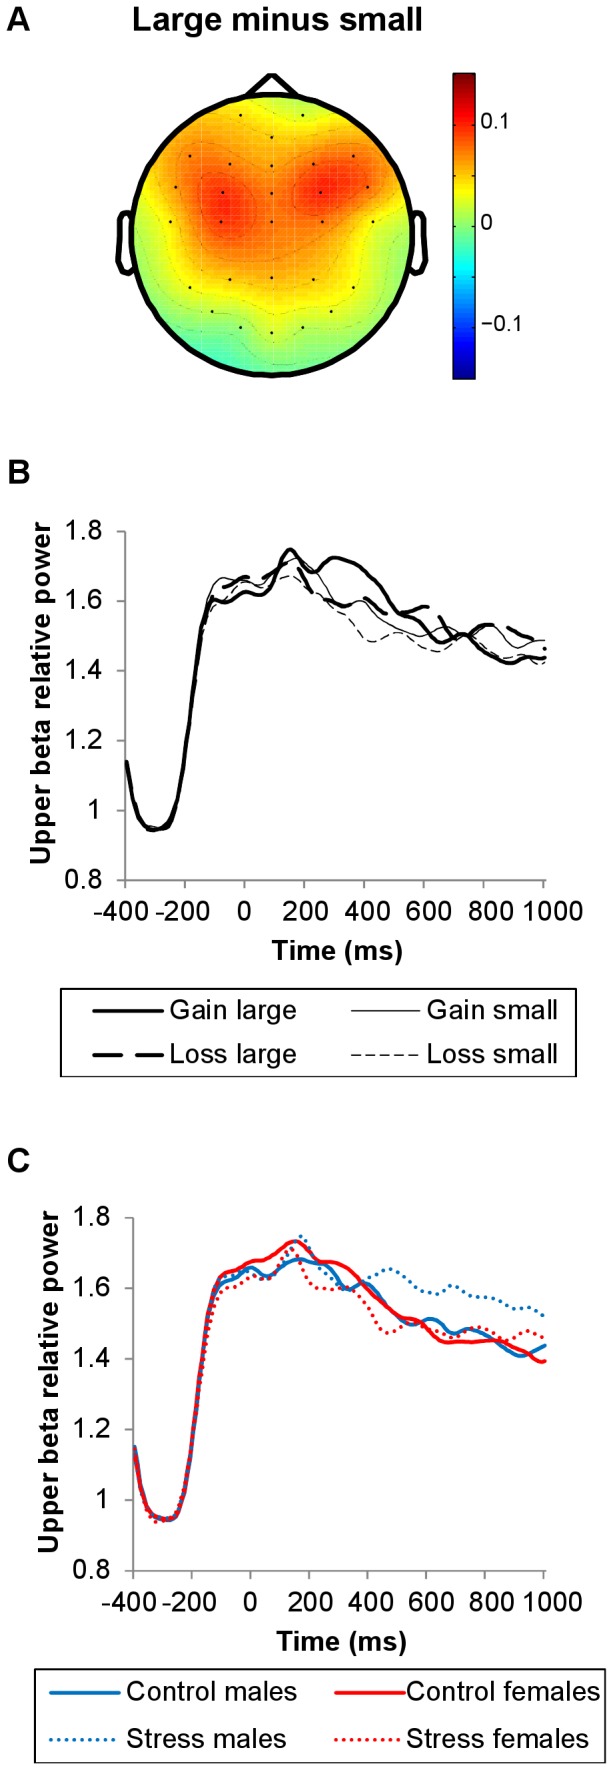
Figure 10. Topographical maps and line plots of upper beta-band relative power.

Plots of upper beta-band relative power (21–30 Hz). (A) Topographical map of the difference between large and small outcome trials (300–600 ms post-feedback). (B) Line plots of upper beta-band relative power at FCz as a function of valence and magnitude. (C) Line plots of upper beta-band relative power at FCz as a function of stress induction and sex. Upper beta-band power increases were larger for large relative to small outcomes (300–600 ms). Neither stress induction nor sex modulated upper beta-band power significantly.
