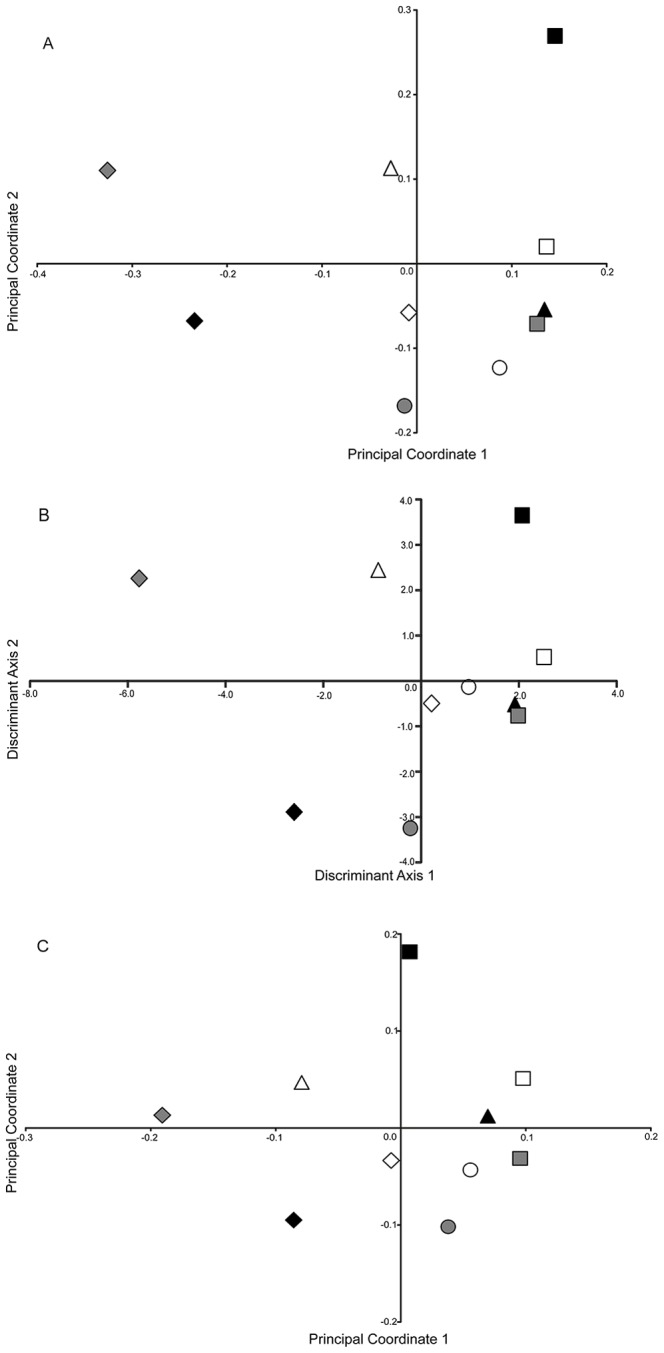
Figure 3. Plots of the populations under three separate analyses.

The percent of the variance explained by the first two axes is shown for each analysis. (A) Population centroids from the Principal Coordinates Analysis of the analysis of all individuals using Dice’s similarity index; 15.7% of the variance explained. (B) Population centroids from the discriminant analysis of the Principal Coordinates data; 46.4% of the variance explained. (C) Principal Coordinates Analysis of the ρ data calculated for each population; 66% of the variance explained. Symbols follow Figure 1.
