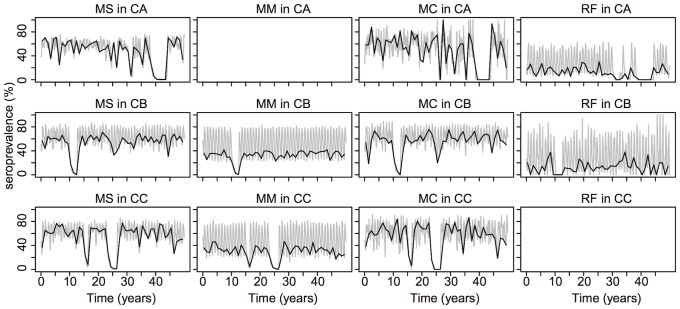
Figure 5. One model simulation run.
Gray lines correspond to anti-EBLV-1 antibody seroprevalence in each subpopulation over 50 years. Black lines correspond to seroprevalence measured at the end of May. The parameter values used are: R 0 = 3, r = 0.6, interisland exchange = 3 individuals, immune-period duration = 6 months, and the default values reported in Table 2 for the incubation- and immune-period durations. Abbreviations are as given in the legend to Figure 3.

