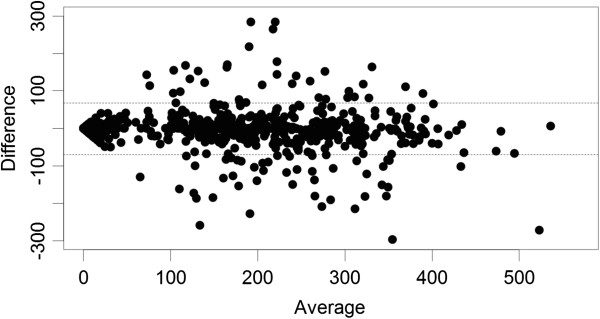
Figure 3.

Bland-Altman plot of total outpatients seen at each facility (health centres and health posts) per week from the SMS system and the paper system during 2011. The difference between the two measures is shown on the y-axis and the average of the two measures is shown on the x-axis.
