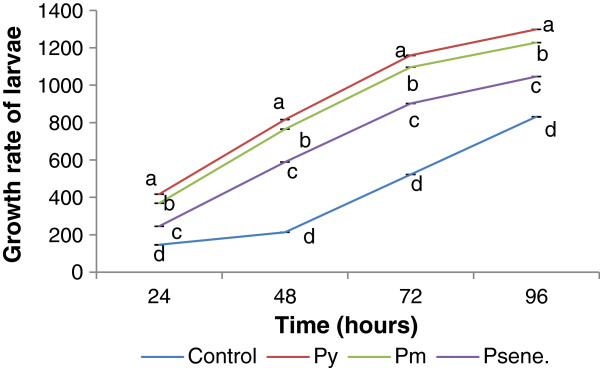
Figure 2.

Growth rate of larvae in S1 leaves treated with 3-10 kDa peptide isolated at different maturity status of leaves (S1) and in control (only S1 leaves). Results are represented as mean ± SEM, n = 3. Values with different letters (a, b, c & d) are significantly (P < 0.05) different from each other by Duncan’s multiple range test (DMRT).
