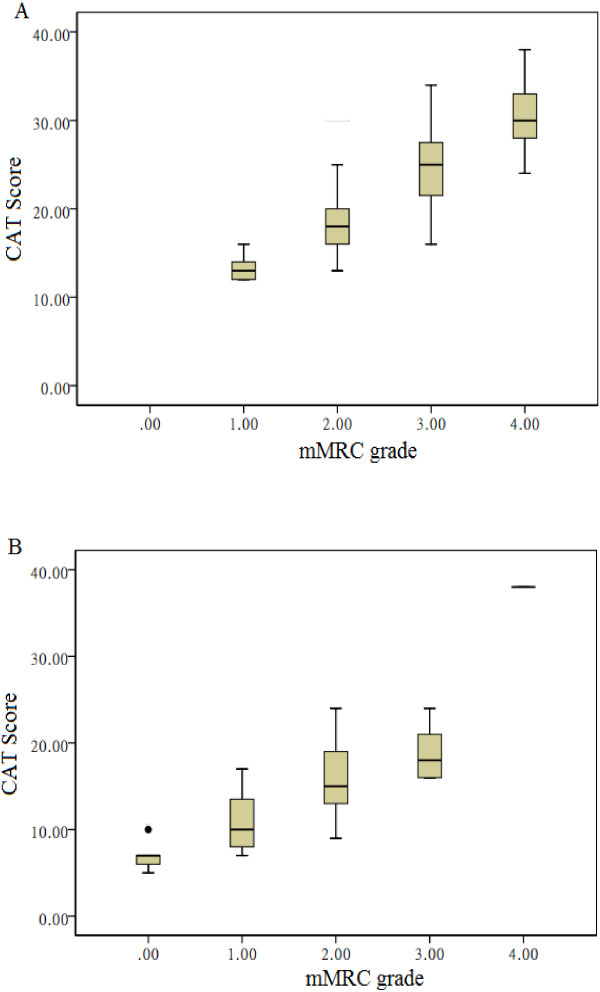
Figure 3.
Box plots of CAT scores in patients grouped mMRC grades at exacerbation (Figure3A) and the 7th day of therapy (Figure3B). The horizontal line through each box represents the median. The ends of each box represent the 25th and 75th percentile locations, and the lines represent the range of the date. The cross of each box represents the mean.

