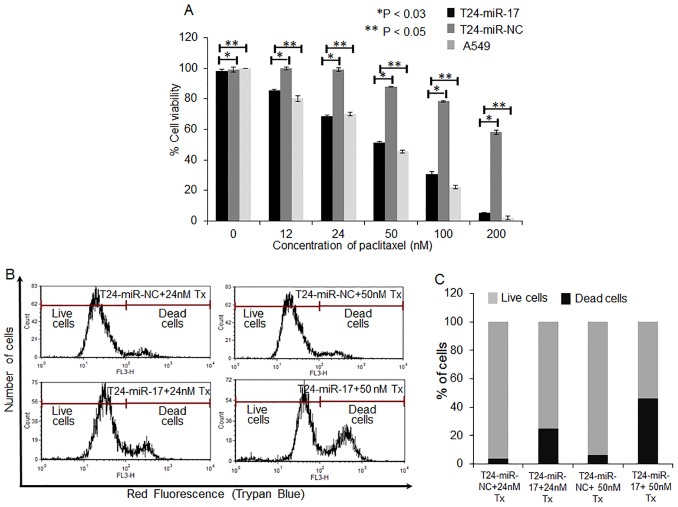
Figure 3. miR-17-5p is functionally involved in the paclitaxel response to A549 cells.
(A) A549-T24 cells were either transfected with 100 nM pre-miR-negative control (T24-miR-NC) or pre-miR-17-5p (T24-miR-17-5p) precursor RNA and were seeded into 96 well plates at a density of 1×10⁴ cells per well. After 24 h, cells were treated with 0, 12, 24, 50, 100, 200 nM paclitaxel for another 24 h. The cell viability was assessed by MTT assay. Data are presented as % of cell viability measured in cells treated with paclitaxel. Columns, mean of three independent experiments; bars, mean ±S.E. (*p<0.05 vs negative control, p<0.03 vs A549 control, where n = 4). (B–C) Cells (T24-miR-NC and T24-miR-17-5p) were subsequently treated with 24 nM and 50 nM paclitaxel for 24 h and are subjected to FACS analysis after being stained by Trypan blue. Histogram represents the Red fluorescence intensity (FL3-H) vs. counts plot where dose dependent increase of cell death occurs. The results represent the best of data collected from three experiments with similar results.

