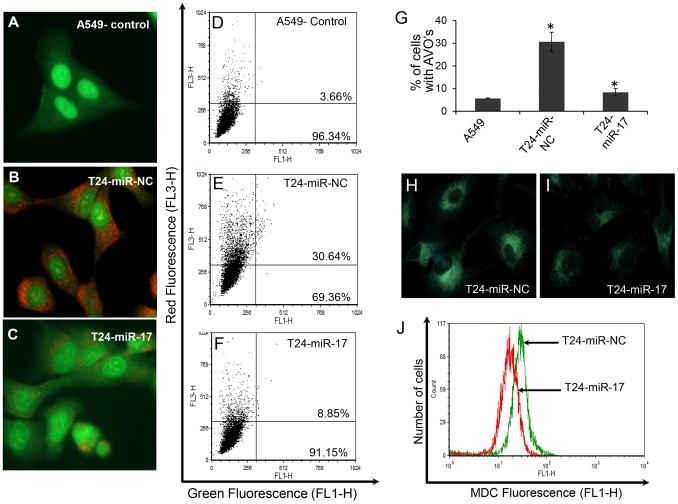
Figure 6. Detection of suppression of autophagy following miR-17-5p overexpression into paclitaxel resistant A549-T24 cells.
T24-miR-NC and T24-miR-17-5p cells were stained with AO for AVO observation under fluorescence microscope (B and C). AO staining of A549 served as the control (A). (D–F) To quantitate change in % of cells developing AVO following miR-17-5p overexpression into A549-T24 cells, flow- cytometric estimation of AVOs were done in A549, T24-miR-NC and T24-miR-17-5p cells respectively. (G) Quantitation of mean AVO positive cells in all three cell lines. Data presented are the mean ± S.E. (*p<0.05 vs control, where n = 3). (H- I) MDC staining of T24-miR-NC and T24-miR-17-5p cells under fluorescence microscope. (J) Quantitation of change in autophagic vacuole formation in T24-miR-17-5p compared to T24-miR-NC cells by MDC staining and Flow- cytometry. Histogram represents relative MDC fluorescence intensity (FL1-H) vs cell counts plot.

