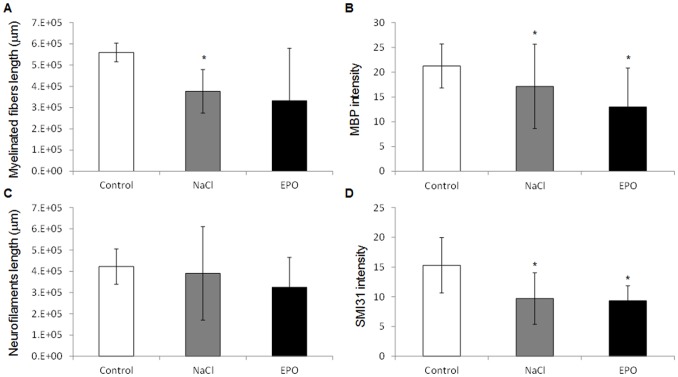
Figure 1. Myelination and neurofilaments in the ipsilateral cortex.
A) Total length of myelinated fibers (µm) of MBP positive stained fibers in the cortex of Control, NaCl and EPO treated rats. B) MBP average fluorescence intensity in the cortex of Control, NaCl and EPO treated rats. C) Total length of neurofilaments (µm) of SMI31 stained fibers in the cortex of Control, NaCl and EPO treated rats. D) SMI31 average fluorescence intensity in the cortex of Control, NaCl and EPO treated rats. All the data are presented as mean ± SD, *: P<0.05, NaCl vs. Control and EPO vs. Control, n = 12 rats for each group, NaCl, EPO and Control.

