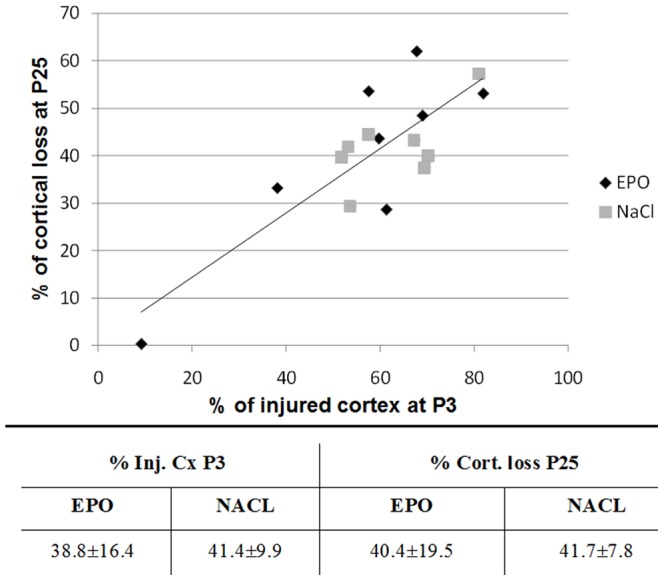
Figure 3. Volumes of cortical injury at P3 and loss at P25.

Upper panel: percentage of cortical loss at P25 as a function of the percentage of injured cortex at P3 for the both groups: EPO and NaCl. A strong correlation independent of the group was found: R2 = 0.67; P = 0.0001. Lower panel: percentage of injured cortex (Inj. Cx) at P3 and percentage of cortical loss (% Cort. loss) at P25 for EPO and NaCl groups. There were no statistical differences between EPO and NaCl groups in terms of cortical injury at P3 and loss at P25. Data are presented as mean ± SD, n = 8 rats for each group, NaCl, EPO and Control.
