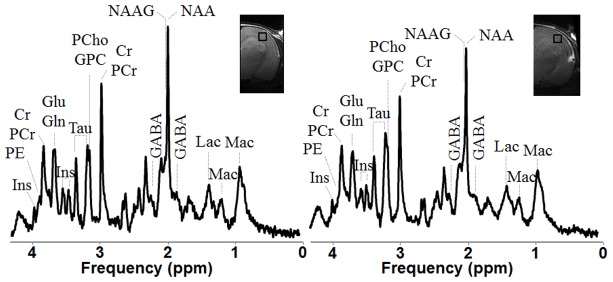
Figure 4. Metabolic profile of cortex.

Typical in1H-NMR spectra at 9.4T in the ipsilateral cortex of one NaCl treated rat pup (right) as well as in the same area of a Control rat cortex with respective metabolite assignments. All spectra (SPECIAL, TE/TR = 2.8/4000 ms, NT = 840) were displayed with Gaussian apodization (gf = 0.11 s) and scaled relative to the concentration of macromolecules. Abbreviations: Mac, macromolecules; Asc, ascorbate; Asp, aspartate; GPC, Glycero-phosphocholine; PCho, phosphorylcholine; Cr, creatine; PCr, phosphocreatine; GABA, γ-aminobuttyric acid; Glc, glucose; Glu, glutamate; Gln, glutamine, Ins, myo-inositol; Lac, lactate; NAA, N-acetylaspartate; NAAG, N-acetylaspartylglutamate; PE, phosphoethanolamine and Tau, taurine.
